Topics
Description
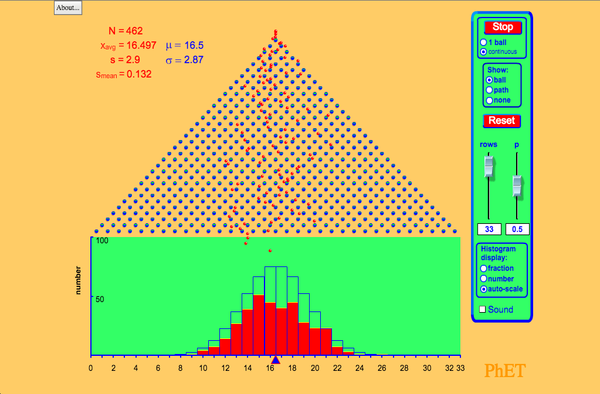
Drop balls through a triangular grid of pegs and see them accumulate in containers. Switch to a histogram view and compare the distribution of balls to an ideal binomial distribution. Adjust the binary probability and develop your knowledge of statistics!
Sample Learning Goals
- Predict the bin where a single ball might fall
- Repeat trials of 100 balls and compare the outcomes
- Count the number of balls in a bin and relate that to the probability of falling in that bin
- Compare and interpret empirical and theoretical statistics
- Apply the plinko simulation as a model to other scenarios where there are weighted statistics
Standards Alignment
Common Core - Math
7.SP.C.5
Understand that the probability of a chance event is a number between 0 and 1 that expresses the likelihood of the event occurring. Larger numbers indicate greater likelihood. A probability near 0 indicates an unlikely event, a probability around 1/2 indicates an event that is neither unlikely nor likely, and a probability near 1 indicates a likely event.
7.SP.C.6
Approximate the probability of a chance event by collecting data on the chance process that produces it and observing its long-run relative frequency, and predict the approximate relative frequency given the probability. For example, when rolling a number cube 600 times, predict that a 3 or 6 would be rolled roughly 200 times, but probably not exactly 200 times.
HSS-IC.A.2
Decide if a specified model is consistent with results from a given data-generating process, e.g., using simulation. For example, a model says a spinning coin falls heads up with probability 0.5. Would a result of 5 tails in a row cause you to question the model?
HSS-ID.A.1
Represent data with plots on the real number line (dot plots, histograms, and box plots).
HSS-ID.A.2
Use statistics appropriate to the shape of the data distribution to compare center (median, mean) and spread (interquartile range, standard deviation) of two or more different data sets.
Version 2.02


